Complete beginner-friendly guide to install Wazuh SIEM server on Ubuntu and configure Sysmon on Windows agents for SOC-grade security monitoring.
Who is this for? Beginners and IT administrators setting up Wazuh for the first time on a physical, virtual, or cloud Ubuntu server.
Table of Contents
- Part 1 — Wazuh Server Setup
- What Is Wazuh?
- Prerequisites
- Step 1: Check Your OS Version
- Step 2: Update the System
- Step 3: Set the Server Hostname
- Step 4: Check Available RAM
- Step 5: Configure Firewall
- Step 6: Install Required Packages
- Step 7: Download the Installer
- Step 8: Run the Installation
- Step 9: Recover Admin Password
- Step 10: Verify Services
- Step 11: Access the Dashboard
- Step 12: Tune JVM Heap
- Step 13: Enroll a Windows Agent
- Step 14: Enroll a Linux Agent
- Troubleshooting
- Part 2 — Sysmon Setup on Windows
- What Is Sysmon?
- Step 1: Download Sysmon
- Step 2: Download Config File
- Step 3: Organize Files
- Step 4: Install Sysmon
- Step 5: Verify Sysmon
- Step 6: Verify Logs
- Step 7: Generate a Test Event
- Step 8: Confirm Wazuh Agent
- Step 9: Configure Agent to Read Sysmon
- Step 10: Restart Wazuh Agent
- Step 11: Verify in Dashboard
Part 1 — Wazuh Server Setup (Ubuntu)
What Is Wazuh?
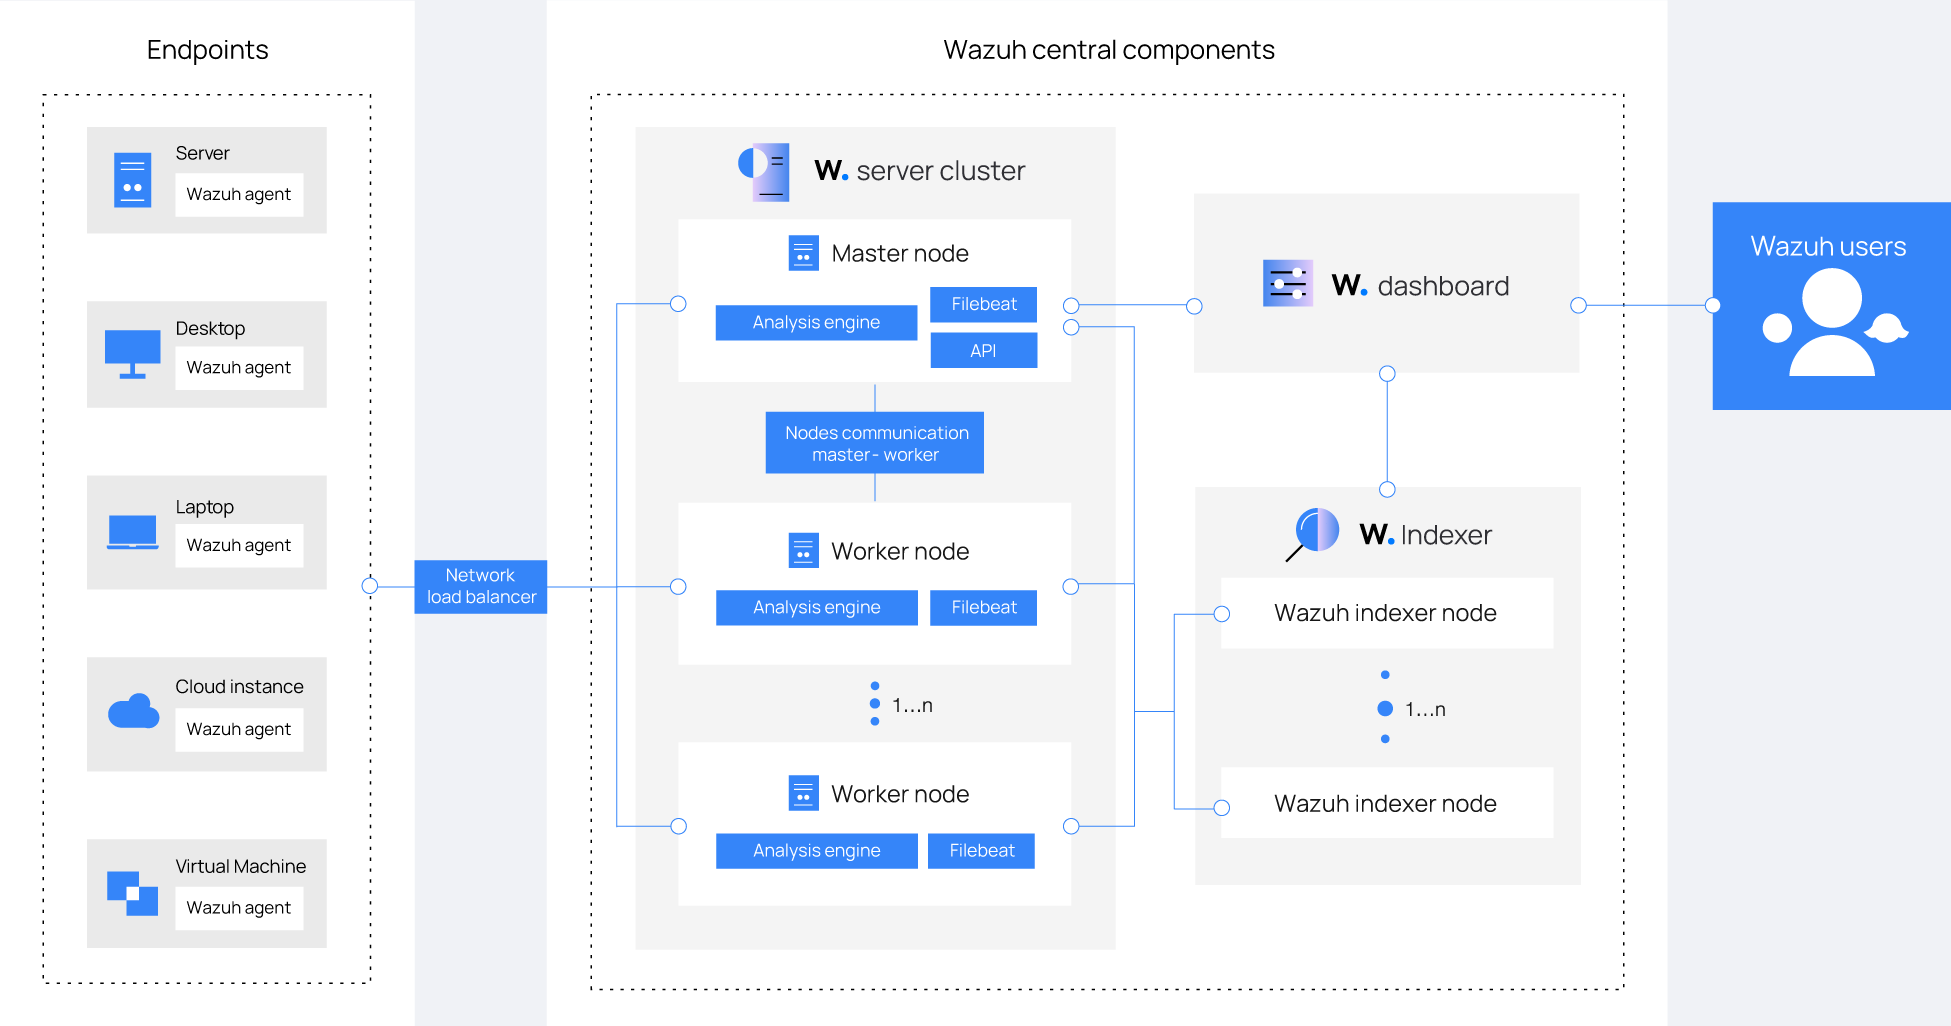
Wazuh is a free, open-source security platform that combines:
- Endpoint protection — monitors Windows, Linux, and macOS machines
- SIEM — Security Information and Event Management
- Log analysis — collects and parses logs from all agents
- File integrity monitoring — detects unauthorized file changes
- Vulnerability detection — flags known CVEs on enrolled machines
By the end of this guide, you will have:
| Component | Port | Purpose |
|---|---|---|
| Wazuh Manager | 1514 | Listens for agent events |
| Wazuh Indexer (OpenSearch) | 9200 | Stores all alerts |
| Filebeat | — | Forwards alerts to the indexer |
| Wazuh Dashboard | 443 | Web UI (HTTPS) |
Prerequisites
Hardware requirements (official):
| Component | Minimum RAM | Minimum CPU | Recommended RAM | Recommended CPU |
|---|---|---|---|---|
| Wazuh Server (all-in-one) | 2 GB | 2 cores | 4 GB | 8 cores |
Disk space per agent (90 days of alerts):
- Servers: ~0.1 GB per agent
- Workstations: ~0.04 GB per agent
- Network devices: ~0.2 GB per agent
Example: 80 workstations + 10 servers + 10 network devices ≈ 6 GB for 90 days of alerts.
Officially supported operating systems:
| OS | Supported Versions |
|---|---|
| Ubuntu | 16.04, 18.04, 20.04, 22.04, 24.04 |
| Red Hat Enterprise Linux (RHEL) | 7, 8, 9, 10 |
| CentOS Stream | 10 |
| Amazon Linux | Amazon Linux 2, Amazon Linux 2023 |
This guide uses Ubuntu for all commands. On RHEL/CentOS/Amazon Linux, the
wazuh-install.shscript works identically — only system update commands differ (yumordnfinstead ofapt).
Required ports — must be free and reachable:
| Port | Protocol | Purpose |
|---|---|---|
| 443 | TCP | Wazuh Dashboard (HTTPS) |
| 1514 | TCP/UDP | Agent event communication |
| 1515 | TCP | Agent auto-enrollment |
| 9200 | TCP | Wazuh Indexer REST API (localhost only) |
| 55000 | TCP | Wazuh Manager REST API |
Critical: If Apache, Nginx, or any other web server is running on port 443, the Wazuh dashboard will fail to start. Stop them before proceeding (covered in Step 2).
Step 1: Check Your OS Version
Confirm your server is running a supported OS version.
lsb_release -a
Expected output (Ubuntu 22.04 example):
No LSB modules are available.
Distributor ID: Ubuntu
Description:    Ubuntu 22.04.4 LTS
Release:        22.04
Codename:       jammy
On RHEL:
cat /etc/redhat-release
On Amazon Linux:cat /etc/os-release
Step 2: Update the System and Free Port 443
Update your system to get the latest security patches and ensure package dependencies resolve correctly.
sudo apt update && sudo apt upgrade -y
Check if port 443 is already in use:
sudo ss -tlnp | grep ':443'
If you see apache2, nginx, or caddy in the output, stop them:
sudo systemctl stop apache2 nginx 2>/dev/null
sudo systemctl disable apache2 nginx 2>/dev/null
If you see no output from the port check, port 443 is free and you are good to continue.
Step 3: Set the Server Hostname (Optional)
Setting a proper hostname makes it easier to identify your server in logs and dashboards.
sudo hostnamectl set-hostname wazuh-server
Verify:
hostname
Expected output:
wazuh-server
Step 4: Check Available RAM
free -h
Expected output example:
               total        used        free
Mem:           7.8Gi       1.2Gi       6.6Gi
| Available RAM | Status | Notes |
|---|---|---|
| Less than 2 GB | Not supported | Indexer will fail to start |
| 2–4 GB | Minimum | Tune JVM heap after install (Step 12) |
| 4 GB or more | Recommended | Suitable for production use |
Step 5: Configure Firewall Ports
For Practice / Lab Environments
The easiest approach is to disable UFW entirely:
sudo ufw disable
Verify it is off:
sudo ufw status
Expected output:
Status: inactive
All ports are now open and Wazuh will work without any firewall configuration.
For AWS EC2 (Practice Setup)
Set your Security Group inbound rule to All traffic → Source: Anywhere (0.0.0.0/0).
AWS Console → EC2 → Security Groups → Your Instance's Security Group
→ Inbound Rules → Edit → Add Rule
→ Type: All traffic
→ Source: Anywhere IPv4 (0.0.0.0/0)
→ Save
Production only: For production use, open only the specific ports listed in Prerequisites and restrict source IPs to trusted ranges.
Production UFW configuration (click to expand)
sudo ufw allow 22/tcp
sudo ufw allow 443/tcp
sudo ufw allow 1514/tcp
sudo ufw allow 1514/udp
sudo ufw allow 1515/tcp
sudo ufw allow 55000/tcp
sudo ufw reload
Step 6: Install Required Packages
sudo apt install -y curl unzip wget
Step 7: Download the Wazuh Installer Script
Wazuh provides an official wazuh-install.sh script that automates everything: APT repository setup, package installation, TLS certificate generation, service startup, and security index bootstrap.
cd /root
curl -sO https://packages.wazuh.com/4.14/wazuh-install.sh
Verify the file was downloaded:
ls -lh wazuh-install.sh
Expected output:
-rw-r--r-- 1 root root 195K Apr 18 22:45 wazuh-install.sh
If you get a 404 error, the version in the URL may have changed. Check packages.wazuh.com for the latest version (e.g.
4.14,4.15) and update the URL accordingly.
Step 8: Run the All-in-One Wazuh Installation
The -a flag installs all four components on this single host: Wazuh Manager, Wazuh Indexer, Filebeat, and Wazuh Dashboard.
sudo bash wazuh-install.sh -a 2>&1 | tee /tmp/wazuh-install.log
2>&1combines stdout and stderr so nothing is missed.tee /tmp/wazuh-install.logshows output on screen AND saves it to a log file for review if something goes wrong.
The installation takes 10–15 minutes. Do not interrupt or close the terminal.
When it finishes successfully, you will see:
INFO: --- Summary ---
INFO: You can access the web interface https://<your-server-ip>
    User: admin
    Password: <GENERATED_PASSWORD>
INFO: Installation finished.
Copy the generated password immediately. If you miss it, recover it using the command in Step 9.
Step 9: Recover the Admin Password (If You Missed It)
Option 1 — Single command (quickest):
sudo tar -O -xvf wazuh-install-files.tar wazuh-install-files/wazuh-passwords.txt
Option 2 — Extract to a folder first, then read:
sudo tar -xf /root/wazuh-install-files.tar -C /tmp/
sudo head -10 /tmp/wazuh-install-files/wazuh-passwords.txt
Look for the admin entry:
# Admin user for the web interface and Wazuh indexer
  indexer_username: 'admin'
  indexer_password: 'YourGeneratedPasswordHere'
Keep the full
wazuh-install-files.tarfile. It contains the root CA and component certificates — needed if you later add a second indexer node or regenerate certificates.
Step 10: Verify All Services Are Running
sudo systemctl is-active wazuh-manager wazuh-indexer wazuh-dashboard filebeat
Expected output — all four should show active:
active
active
active
active
If any service shows
inactiveorfailed:sudo journalctl -u wazuh-manager --no-pager | tail -20
Verify ports are listening:
sudo ss -tlnp | grep -E ':443|:1514|:55000|:9200'
The indexer (9200) only binds to
127.0.0.1— this is intentional. Do not expose port 9200 to the network.
Step 11: Access the Wazuh Dashboard
Open a browser and go to:
https://<your-server-ip>:443
The dashboard uses a self-signed SSL certificate. Your browser will show a security warning — click Advanced → Proceed to continue. This is expected on first visit.
Log in with:
- Username:
admin - Password: The generated password from Step 8 or 9
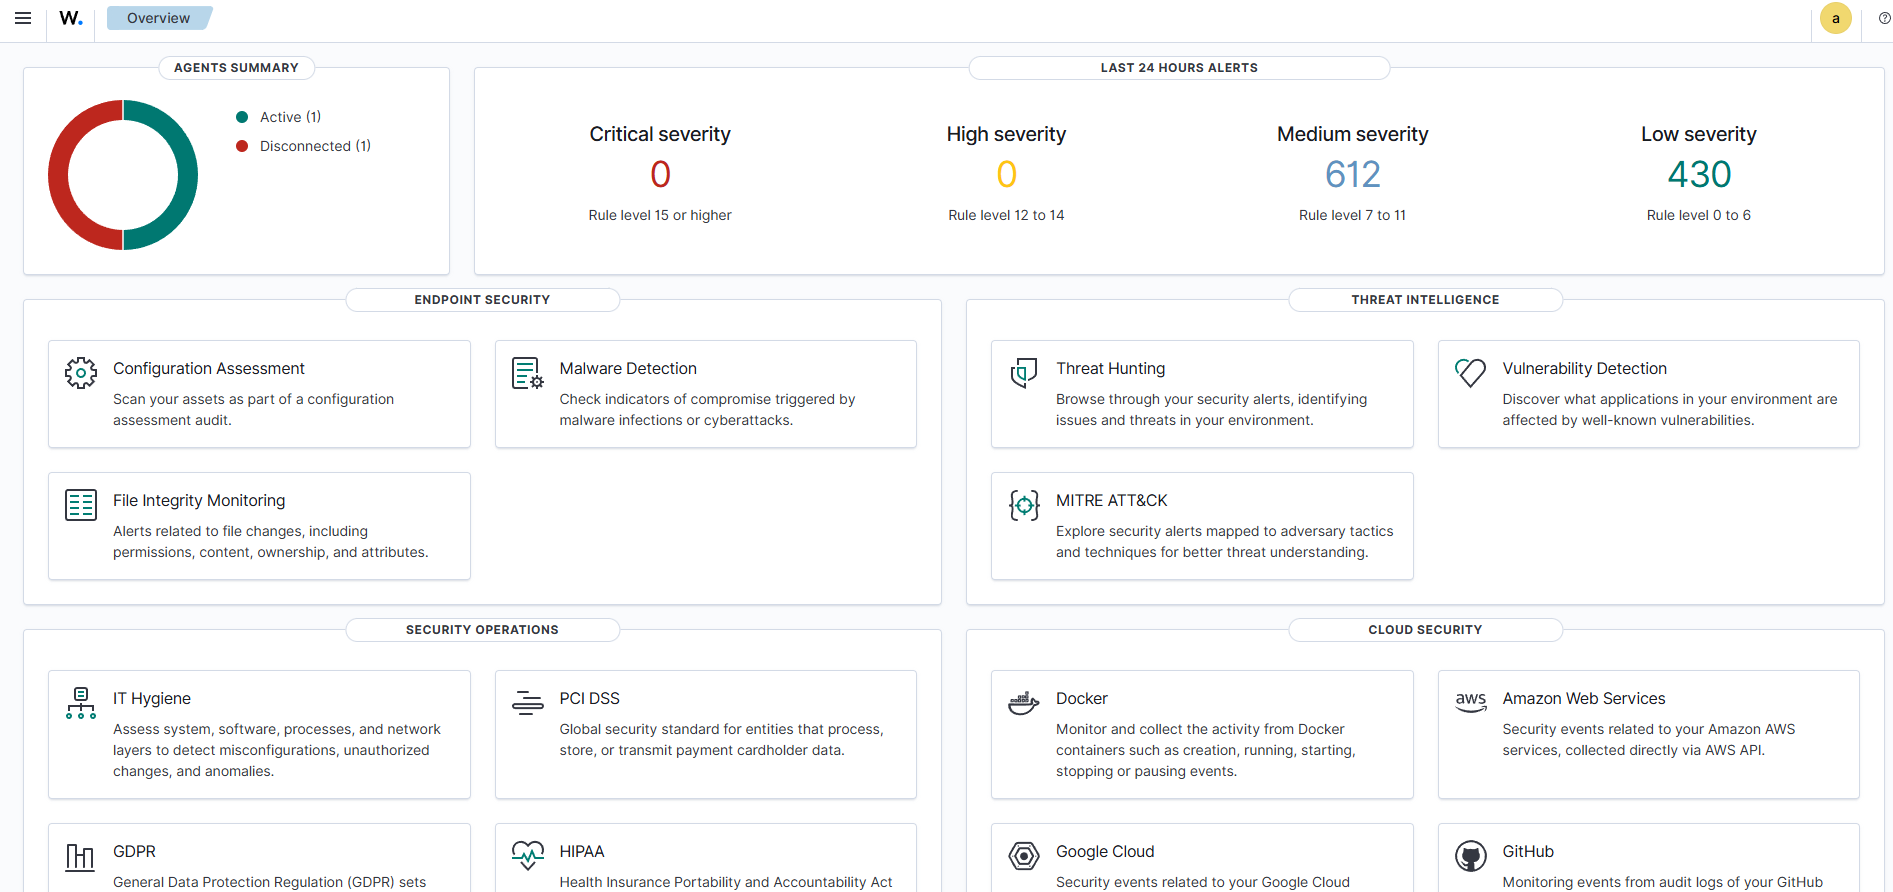
After login, you will land on the Wazuh overview dashboard. It will show empty panels until the first agent is enrolled.
Change the admin password after first login (if needed):
Go to: Security → Internal Users → admin → Edit → Set new password
Or via CLI:
sudo /usr/share/wazuh-indexer/plugins/opensearch-security/tools/wazuh-passwords-tool.sh \
  -u admin -p 'YourNewStrongPassword@2026'
Step 12: Tune JVM Heap for Low-RAM Servers (If Needed)
The installer sets the indexer JVM heap to 4 GB by default. On a server with exactly 4 GB RAM, this leaves almost no memory for the OS.
sudo nano /etc/wazuh-indexer/jvm.options
Find the -Xms and -Xmx lines and set them to half your total RAM:
| Server RAM | Recommended Heap Setting |
|---|---|
| 4 GB | -Xms1g and -Xmx1g |
| 8 GB | -Xms4g and -Xmx4g (default) |
| 16 GB+ | -Xms8g and -Xmx8g |
Restart the indexer after editing:
sudo systemctl restart wazuh-indexer
sudo systemctl status wazuh-indexer --no-pager | head -6
Step 13: Enroll a Wazuh Agent (Windows)
On the Wazuh Dashboard, go to Agent Summary → Deploy New Agent.
Select:
- OS: Windows
- Server address: Your Wazuh server IP (e.g.
192.168.1.50) - Agent name: Optional (e.g.
Windows-PC1)
Copy the generated PowerShell command and run it as Administrator on the Windows machine.
Template command (replace the IP):
Invoke-WebRequest -Uri https://packages.wazuh.com/4.x/windows/wazuh-agent-4.8.0-1.msi -OutFile $env:TEMP\wazuh-agent.msi
msiexec.exe /i $env:TEMP\wazuh-agent.msi /q WAZUH_MANAGER='<WAZUH_SERVER_IP>' WAZUH_AGENT_NAME='Windows-PC1'
NET START WazuhSvc
⚠️ Version Notice: The MSI filename above (
wazuh-agent-4.8.0-1.msi) is hardcoded and will become outdated as Wazuh releases new versions. Instead of using this template directly, always copy the enrollment command from your Wazuh Dashboard → Agent Summary → Deploy New Agent — it auto-fills the correct version and your server IP.
The agent should appear with a green Active status in the dashboard within 1–2 minutes.
Step 14: Enroll a Wazuh Agent (Linux)
On the Wazuh Dashboard, go to Agent Summary → Deploy New Agent.
Select:
- OS: Linux (DEB) for Ubuntu/Debian or Linux (RPM) for RHEL/CentOS
- Server address: Your Wazuh server IP
- Agent name: Optional (e.g.
Ubuntu-PC1)
Copy the generated command and run it on the Linux machine as root or sudo.
Example generated command (Ubuntu/Debian):
curl -s https://packages.wazuh.com/key/GPG-KEY-WAZUH | gpg --no-default-keyring --keyring gnupg-ring:/usr/share/keyrings/wazuh.gpg --import
chmod 644 /usr/share/keyrings/wazuh.gpg
echo "deb [signed-by=/usr/share/keyrings/wazuh.gpg] https://packages.wazuh.com/4.x/apt/ stable main" | tee /etc/apt/sources.list.d/wazuh.list
apt-get update
WAZUH_MANAGER="<WAZUH_SERVER_IP>" apt-get install wazuh-agent
systemctl daemon-reload
systemctl enable wazuh-agent
systemctl start wazuh-agent
Always prefer copying from the dashboard — it pre-fills your server IP automatically.
Confirm the agent is running:
sudo systemctl status wazuh-agent --no-pager | head -6
Expected output:
● wazuh-agent.service - Wazuh agent
     Loaded: loaded
     Active: active (running)
Troubleshooting
| Problem | Cause | Fix |
|---|---|---|
| Dashboard not loading after install | Port 443 blocked by Apache/Nginx | sudo systemctl stop apache2 nginx then sudo systemctl restart wazuh-dashboard |
| Installer fails with “no space left on device” | Disk full during vulnerability DB import | Ensure at least 50 GB free disk space, then reinstall |
| Dashboard shows “server is not ready” (503) | Indexer still starting | Wait 60 seconds; verify: systemctl status wazuh-indexer |
| Wazuh indexer fails to start | Low RAM — JVM heap too large | Tune JVM heap in /etc/wazuh-indexer/jvm.options (Step 12) |
| Agent shows as Disconnected | Port 1514/1515 blocked | Open ports on server firewall and cloud security group |
| Services not active after reboot | Services not set to auto-start | sudo systemctl enable wazuh-manager wazuh-indexer wazuh-dashboard filebeat |
Uninstall Wazuh (if needed):
sudo bash wazuh-install.sh -u
sudo rm -rf /var/ossec /var/lib/wazuh-indexer /etc/wazuh-indexer \
  /var/log/wazuh-indexer /var/lib/wazuh-dashboard /etc/wazuh-dashboard \
  /etc/filebeat /var/lib/filebeat /root/wazuh-install-files.tar
Part 2 — Sysmon Setup on Windows
What Is Sysmon and Why Do You Need It?
Sysmon (System Monitor) is a lightweight Windows system service from Microsoft Sysinternals. It logs detailed system activity to the Windows Event Log — far beyond what Windows records by default.
The problem with default Windows logging: Default logs tell you something happened, but not the full picture. You might see a process started, but not what network connection it made or which parent process launched it.
What Sysmon adds:
| Event Type | What It Captures | Why It Matters |
|---|---|---|
| Process Creation (Event ID 1) | Every process launched with full command line and parent info | Detect malware execution |
| Network Connections (Event ID 3) | Outbound/inbound connections with the process name | Detect C2 traffic |
| File Creation (Event ID 11) | New files written to disk | Detect ransomware |
| Registry Changes (Event ID 12/13) | Registry key modifications | Detect persistence |
| PowerShell Activity (Event ID 7) | DLL loads and script execution | Detect living-off-the-land attacks |
Sysmon + Wazuh = SOC-grade visibility on a budget. Together they detect lateral movement, credential dumping, ransomware behavior, and MITRE ATT&CK techniques that standard Windows logging would miss entirely.
Requirements
| Requirement | Details |
|---|---|
| Operating System | Windows 8.1 / Windows Server 2012 R2 or later |
| Architecture | 64-bit (use Sysmon64.exe) or 32-bit (use Sysmon.exe) |
| Privileges | Local Administrator or Domain Admin |
| Wazuh Agent | Must already be installed (see Part 1, Step 13) |
Step 1: Download Sysmon
Download from Microsoft Sysinternals:
https://learn.microsoft.com/en-us/sysinternals/downloads/sysmon
Extract the ZIP file:
| File | Use For |
|---|---|
Sysmon64.exe |
64-bit Windows (most modern systems) |
Sysmon.exe |
32-bit Windows only |
Sysmon64a.exe |
ARM64 systems only |
Step 2: Download a Sysmon Configuration File
Sysmon without a config captures very little. Use the widely-trusted community config from SwiftOnSecurity:
https://github.com/SwiftOnSecurity/sysmon-config
Download: sysmonconfig-export.xml
This config is maintained by security professionals and covers the most important detection use cases while filtering out high-volume, low-value events.
Step 3: Organize the Files
C:\Sysmon\
 ├── Sysmon64.exe
 └── sysmonconfig-export.xml
Step 4: Install Sysmon
Open Command Prompt as Administrator (Right-click → Run as administrator).
cd C:\Sysmon
Sysmon64.exe -accepteula -i sysmonconfig-export.xml
Expected output:
System Monitor v15.x - System activity monitor
...
Sysmon installed.
SysmonDrv installed.
SysmonDrv started.
Sysmon started.
The
-accepteulaflag accepts the license silently. Without it, the installer pauses for interactive acceptance.
Step 5: Verify Sysmon Is Running
sc query Sysmon64
Expected output:
SERVICE_NAME: Sysmon64
        TYPE               : 1  KERNEL_DRIVER
        STATE              : 4  RUNNING
Step 6: Verify Sysmon Logs Are Being Generated
Open Event Viewer (eventvwr.msc) and navigate to:
Applications and Services Logs
 └── Microsoft
      └── Windows
           └── Sysmon
                └── Operational
You should see events populating immediately.
Look for:
- Event ID 1 — Process Creation (every program that started)
- Event ID 3 — Network Connection (every outbound connection)
Step 7: Generate a Test Event
notepad.exe
Go back to Event Viewer → Sysmon → Operational. Look for a new Event ID 1 showing:
Image: C:\Windows\System32\notepad.exe
CommandLine: notepad.exe
ParentImage: C:\Windows\System32\cmd.exe
This confirms Sysmon is capturing process launches with full parent/child detail.
Step 8: Confirm the Wazuh Agent Is Installed
sc query WazuhSvc
Expected output:
STATE : 4 RUNNING
If not installed, go back to Part 1, Step 13.
Step 9: Configure the Wazuh Agent to Read Sysmon Logs
Open the Wazuh agent config file in Notepad as Administrator:
C:\Program Files (x86)\ossec-agent\ossec.conf
Do NOT delete anything already in this file. Scroll to the bottom, find the closing
</ossec_config>tag, and insert the block ABOVE it.
Add this block just before </ossec_config>:
<localfile>
  <location>Microsoft-Windows-Sysmon/Operational</location>
  <log_format>eventchannel</log_format>
</localfile>
Save and close the file.
Step 10: Restart the Wazuh Agent
NET STOP WazuhSvc
NET START WazuhSvc
Or via services.msc: find Wazuh → right-click → Restart.
Step 11: Verify Sysmon Events Are Arriving in the Dashboard
Go to your Wazuh Dashboard:
https://<wazuh-server-ip>:443
Navigate to: Agents → [Your Windows Agent] → Threat Hunting
| Check | Expected Result |
|---|---|
| Windows agent status | Active (green) |
| Sysmon alerts in Threat Hunting | Events visible with Sysmon rule groups |
| Event ID 1 (Process Creation) visible | Shows process name, user, parent process |
If no Sysmon events appear after 2–3 minutes, check the agent log at:
C:\Program Files (x86)\ossec-agent\ossec.logLook for errors related toMicrosoft-Windows-Sysmon/Operational.
What to Do Next
- Add more agents across all Windows and Linux machines in your domain
- Configure custom alert rules under
/var/ossec/etc/rules/local_rules.xml - Explore dashboard modules: Threat Hunting, Vulnerability Detection, MITRE ATT&CK, File Integrity Monitoring
- Deploy Sysmon via GPO across all domain computers for automatic monitoring
- Review the official documentation: documentation.wazuh.com
References
- Wazuh Official Documentation
- Wazuh Quick Start Guide
- Microsoft Sysmon Download
- SwiftOnSecurity Sysmon Config
- Wazuh GitHub Repository
License
This project is licensed under the MIT License.
© 2026 Shrikishan — Free to use, share, and adapt with credit.